Demystifying the Data Analysis Process: Unveiling Insights through Questioning, Wrangling, and Exploration
BLOG №6
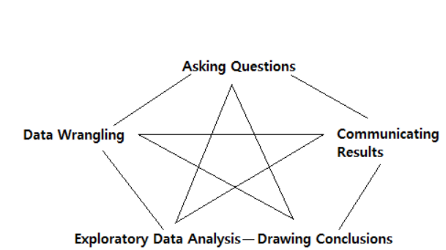
In the realm of data analysis, unraveling the hidden stories within vast amounts of information requires a systematic approach. From my perspective, I will guide you through the five essential steps that constitute the data analysis process: Question, Wrangle, Explore, Draw Conclusions, and Communicate. By following these steps, you can embark on a journey of discovering valuable insights from raw data.
- Question:
The first step is to ask questions. Sometimes, we ask questions first and then gather the data, while other times we obtain the data first and ask questions based on it.
To better understand this step, it's a good idea to learn by doing a project. If you're interested, you can find my project on my GitHub account, and you can also download the HTML file for details.
In the introduction of my project, I've posed some questions, such as:
- Question 1: What are the names of the top films with the highest vote count, budget, revenue, popularity score, and vote average?
- Question 2: What are the shapes of the distribution? Which variables are skewed to the left or right?
- Wrangle:
The second step is to wrangle the data. This involves three steps: gather, assess, and clean. First, you gather the necessary data to answer your questions. This can be done by downloading files, getting data from an API or web scraping, or pulling data from existing databases. You might also need to combine data from multiple different formats.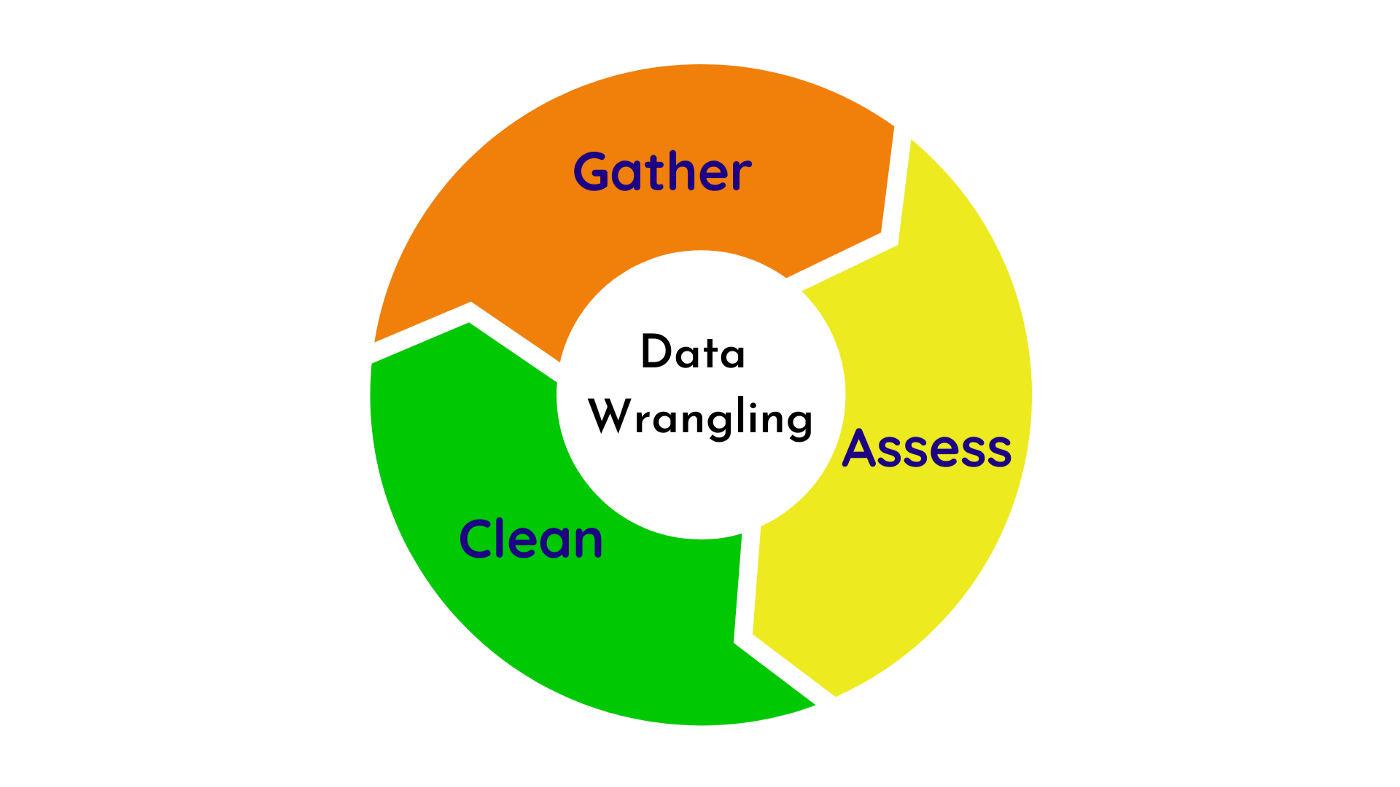
In the gathering phase of my project, I downloaded a readily available file. However, there are other ways to gather data as well, such as:
- Downloading files that are already available.
- Getting data from an API or by web scraping.
- Pulling data from existing databases.
Sometimes, you may also need to combine data from multiple different formats.
After gathering the data, it is often helpful to combine it into a CSV (Comma-Separated Values) format. CSV is a simple file format where data is organized in rows and columns, making it easy to read the file in tools like Jupyter Notebook.
Speaking of Jupyter Notebook, it is a popular tool for writing and running code, especially in Python. It provides an interactive environment where you can execute code, visualize data, and document your analysis.
Once you have your data loaded into data frames, you can use the Pandas library, which is a Python library for data manipulation and analysis. Pandas makes it easy to investigate the data by providing convenient functions and methods.
In my project, you can see the details of the data wrangling process, including the General Properties section. After gathering and loading the data, the next step is to clean it based on your assessment. In my project, I handled six steps in the data cleaning part, such as dropping duplicate rows, appending new cells, and renaming columns.

After completing the data cleaning step, we can move on to the next phase, which is the Exploratory Data Analysis (EDA) step.
3. Explore:
Once you have your data, you move on to explore data with visuals. This is where you investigate the data and gain insights. You can find patterns in your data by creating plots. Histograms and scatterplots, as shown in the post above, can help you determine which variables to use in your analysis.


4. Draw Conclusions:

5. Communicate:

You can also learn the concepts from that video.
Mehrol Bazarov


Comments
Post a Comment